Gold 10x Upside: A Trade Idea From Goldman
With gold having been left long ago at the station, abandoned by the “hard money” crowd which together with today’s youth has found a new fascination with “digital gold” i.e., cryptos, in a dynamic profiled recently by JPMorgan which said that “Institutions Are Rotating Out Of Gold Into Bitcoin As A Better Inflation Hedge“, even as inflation is soaring to levels not seen since the days of Paul Volcker’s hyperinflation, is gold about to have a new chance to shine? According to a recent burst of pro-gold articles, golden sentiment may be about to shift.
As Bloomebrg writes today, “gold may outperform the S&P 500 Index about 20% as the threat of stagflation becomes real.” It elaborates:
Concerns over peak economic growth are coinciding with rising inflation, which pushed the real yield on Treasuries to record lows. The high correlation between the real yield and gold suggests bullion is undervalued. Trading signals based on 20-week moving averages imply a potential breakout rally over the next year.
One of the factors cited by Bloomberg is that gold has a strong inverse relationship with the U.S. real interest rate, which has resumed its slide into negative territory since March. Gold prices and the real yield have an r*square of 0.91 on the regression model over the last five years and the red asterisk below the red line signals gold prices are undervalued for the current level of yield.
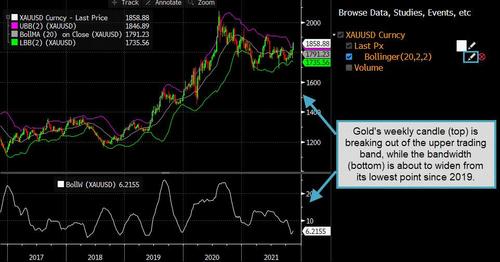
Separatley, Bloomberg takes us on a quick tour of Bollinger Band studies, which plot lines above and below a simple moving average at a specified number of standard deviations to identify periods of high and low volatility. The first chart shows the weekly candle is breaking out of the upper trading band.
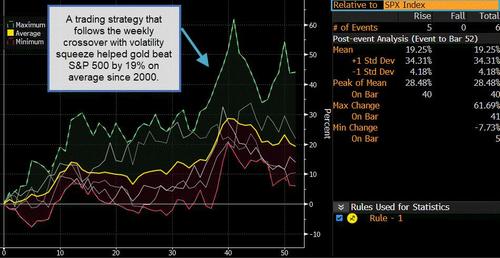
The next chart shows the bandwidth is about to widen from its lowest point since 2019 which created a so-called volatility squeeze. It suggests a significant increase in volatility ahead, potentially in favor of gold. And, as Bloomberg further notes, a trading strategy that follows the weekly crossover with a volatility squeeze has helped gold to beat S&P 500.
There have been five cases where gold crossed above its 20-week moving average with bandwidth below 6 over the past two decades. On average, bullion outperformed S&P 500 by 19% over the next 52 weeks with no losing record. The sixth signal is still counting. As Bloomberg concludes, “if this pattern repeats, gold is well primed to outshine S&P 500 next year.”
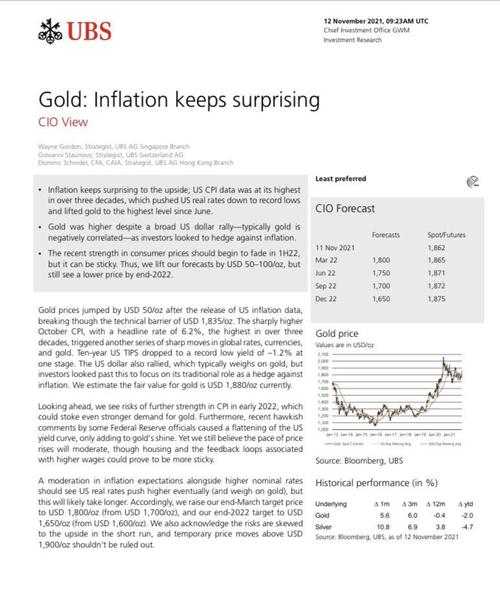
In addition to Bloomberg, in a Friday note, UBS strategist Wayne Gordon looked at the recent surge in the price of gold, which jumped $50/oz after the release of US inflation data, which helped it break above the barrier of $1,835. Looking ahead, UBS sees “risks for further strength in CPI in early 2022, which could stoke even stronger demand for gold” while “recent hawkish comments by some Fed officials caused a flattening of the US yield curve, only adding to gold’s shine.” As a result, UBS raised its end-March pricate target modestly from $1,700 to $1,800 while acknowledging that risks are “skewed to the upside in the short run, and moves above $1,900 should not be ruled out.”
So, gold above $1,900, hardly a shocker since the yellow metal is already trading just $35 away.
A far more convincing pitch for gold also on Friday came from none other than Goldman’s head of energy research Damien Courvalin who repeated the bank’s recent optimistic talking points on the yellow metal in an interview with Bloomberg in which he said that “gold is set to boom” far higher from its current price.
Which actually brings us to the punchline: a trade idea for gold, also from Goldman, courtesy of the bank’s European strategist Bernhard Rzymelka who urges clients to “consider levered gold upside” which while attractive exposure in its own right is also cheap optionality on even lower real yields.
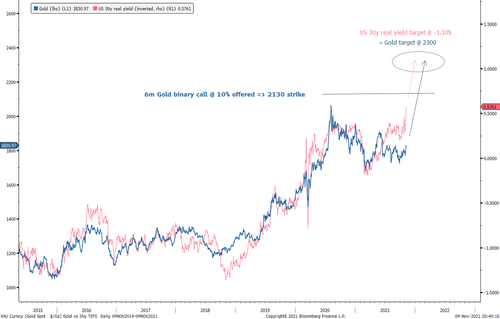
The trade idea is as follows: Buy Gold 6m expiry $2130 binary call @ 10% offered
- 10x maximum payout
- Ref. $1830 spot, 26 Apr 22 expiry date
- Risks to the downside limited to premium spent
His four investment highlights:
- The yellow metal looks ready to break higher on chart & follow the rally in US real yields
- Our -1.10% target for 30y real yields equates to $2300 in Gold
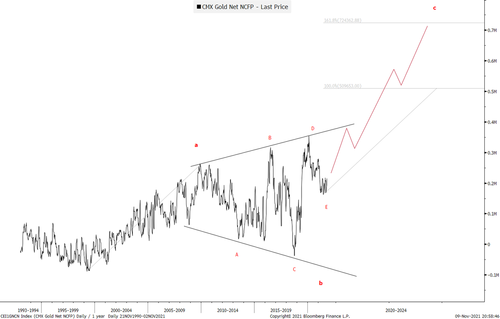
- Positioning in gold is light and looks ready to build higher
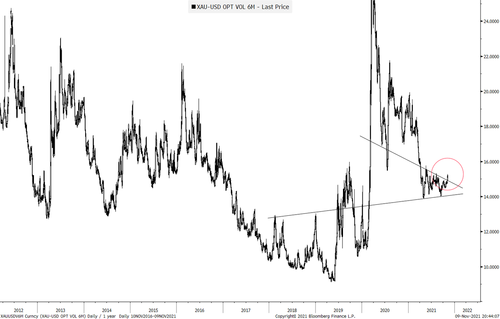
- Implied volatility remains close to the 2 year lows & has started to break higher today
Charts below:
Gold with upside to $2300 if real yields hit their -1.10% target. Options markets offer attractive upside over the next 3-6 months.
Implied 6m volatility has started to break higher, suggesting it is an attractive buy if the downside momentum in real yields extends as expected… and gold starts catching up.
Gold positioning by non-commercials has consolidated & looks ready to make new highs. At this point feel free to make fun of applying Elliott waves to CFTC positioning… but it should arguably reflect human psychology as much as the price chart itself. For the latter see below from the MarketStrats chart guru MacNeil Curry.
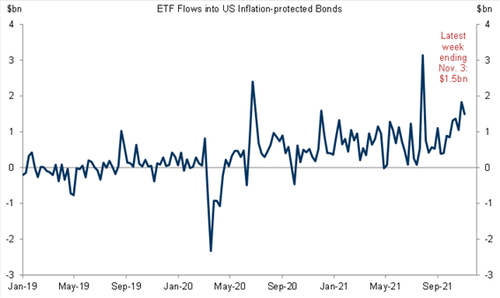
What if… flows into inflation-protected bonds start extending into gold? At 0% real yield the yellow metal looks increasingly attractive versus TIPS at -0.60% and falling.
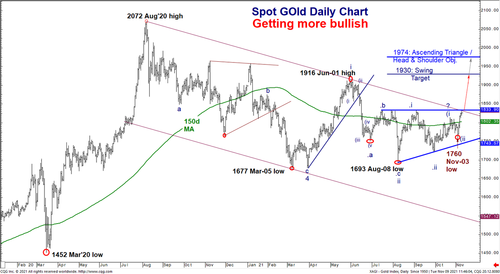
Gold chart: On the brink of a breakout. A break of 1833 targets 1930, potentially 1947. Real yields are supportive of higher gold prices
- On a medium term (multi-month) basis we have been bullish. The series of impulsive advances from the March/April lows and more recently from the Aug-08 and Sep-29 lows point to higher prices.
- While the lack of upside acceleration has been increasingly frustrating price and pattern still point higher.
- Further supportive of higher gold prices is the strong inverse correlation btwn 10yr Real Yields and Gold (see chart 2) and the increasing likelihood that fact that 10yr Real Yields are set to make new all time lows (and resume their bull trend – see above)
- Indeed, a move above 1833 (14m channel top in brown and almost 4m ascending triangle resistance in royal blue) would confirm the bullish potential, targeting 1930 (swing target) ahead of 1974 (measured moves)
- Back through the Nov-03 low of 1760 warns of stalling, while a move below 1744 (Ascending Triangle support royal blue) would say that our bullish view is misplaced
* * *
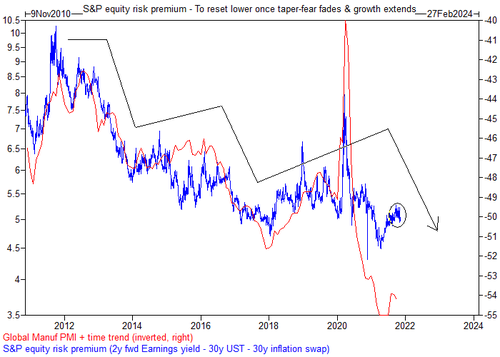
Post scriptum 1: How will investors feel about an equity risk premium at 5.5% once real yields trade -1% all else equal?
Post scriptum 2 from Rzymelka: “You are crazy. 30y bond yields can never rally if inflation (term) premium reprices this much higher.” Well.. in normal times that probably is true. But not after a major shock & policy response that jointly turbo charge BOTH the structural “savings glut” AND the cyclical “catch up recovery”. In fact, the former puts the latter on steroids^2. Sounds crazy. Is crazy. So lever up. This will probably be the best (and possibly final) party of our generation.”

Learn How To Take Physical Control of Your Saving with this FREE GUIDE
Contact Us
To learn more about buying or investing in precious metals, or if you would just like to talk about the field, please reach out to us any time.

